Debugging D3D applications can be a pain, but it´s completely necessary sometimes if you want to know what´s going on in your D3D application (error codes don´t give much information without the debug output).
However, things have changed quite a bit recently in the latest versions of Windows (8.1), Visual Studio (2013) and DirectX (11.2). The following video explains some of the changes related to D3D Debugging, the DirectX Control Panel, and how all the new infrastructure works:
You can also access the content in the form of slides.
Keep in mind that some of the DirectX features are no longer distributed with the DirectX SDK, but with the Windows SDK. So, we will try to cover all the possible cases you could face when trying to activate the Debug Output in D3D, no matter if you work in Windows 7 with the old version of DirectX SDK (June 2010), if you are in Windows 7 or Windows 8 and use the new Windows SDK, or if you are in the latest Windows 8.1 with its own Windows SDK.
So, if you are developing for D3D 10.x or 11.x, use the new one as the old one won´t have any effect. If you are still using D3D9 and the old DX SDK 2010, grab the one on your left.
Note: See the above video to learn about new features in the panel like the “Feature level limit”.
That should force your DirectX applications to use the Debug version of the DirectX libraries, so you should immediately start to see debug output in Visual Studio.
Activating the debug output in D3D 10.x / 11.x is a bit different, as settings are handled per application (you need to add your exe to a list in the control panel, and set an specific configuration for it in there). To do so, please follow these steps:
You can find more info here, but basically what you need to do is create your Device with Creation Flags including the D3D11_CREATE_DEVICE_DEBUG flag.
What I can tell you is that, unfortunately, D3D9 debugging seems to be disabled in Windows 8.1. If you open the OLD DX Control Panel, you will see that all the debug parts of the D3D 9 tab are grayed out. I tried by all means to bring it back with no luck, so if you manage to enable it, please let me know.
Also, remember to create your devices specifying the D3D11_CREATE_DEVICE_DEBUG creation flag (as described above), and in the case of developing in C#, remember to activate the “Enable native code debugging” option in your main project.
However, things have changed quite a bit recently in the latest versions of Windows (8.1), Visual Studio (2013) and DirectX (11.2). The following video explains some of the changes related to D3D Debugging, the DirectX Control Panel, and how all the new infrastructure works:
You can also access the content in the form of slides.
Keep in mind that some of the DirectX features are no longer distributed with the DirectX SDK, but with the Windows SDK. So, we will try to cover all the possible cases you could face when trying to activate the Debug Output in D3D, no matter if you work in Windows 7 with the old version of DirectX SDK (June 2010), if you are in Windows 7 or Windows 8 and use the new Windows SDK, or if you are in the latest Windows 8.1 with its own Windows SDK.
The New DirectX Control Panel
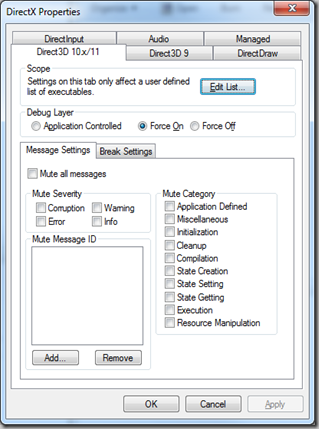
We will need to deal with it to enable D3D debug and to manage other stuff, so first thing is to learn to differentiate between the old one (June 2010 DirectX SDK) and the new ones (Windows SDK). It´s easy: the new ones only include one tab (Direct3D 10.x/11.x):So, if you are developing for D3D 10.x or 11.x, use the new one as the old one won´t have any effect. If you are still using D3D9 and the old DX SDK 2010, grab the one on your left.
Note: See the above video to learn about new features in the panel like the “Feature level limit”.
Windows 7
D3D 9.x
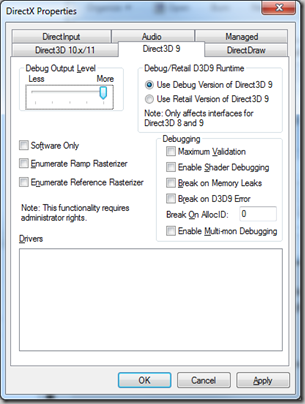
If you are still developing with D3D9, honestly you should seriously consider moving forward. But if you can´t, and you need to enable debug in your app, you just need to use the OLD Control Panel described above, and navigate to the Direct3D 9 tab to make sure you select “Use Debug Version of Direct3D 9”, and turn the Debug Output Level to “More”, just like depicted in the following image:
That should force your DirectX applications to use the Debug version of the DirectX libraries, so you should immediately start to see debug output in Visual Studio.
Managed D3D9 applications (SlimDX, SharpDX and similar wrappers)
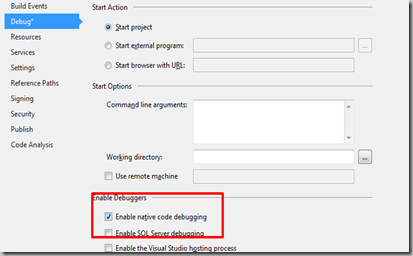
If you are developing in C#, keep in mind that you will also need to activate the flag “Enable native code debugging” under the Debug tab of your main project properties in Visual Studio. If not, the native debug output cannot get through to the output window.
D3D 10.x / 11.x
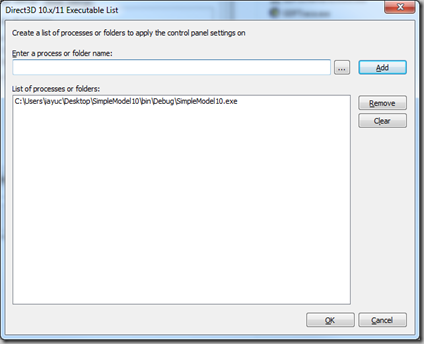
Important None: The necessary components for debugging D3D 10.x and 11.x are no longer installed with the old DirectX SDK (June 2010). In order to have them you need to install the Windows 8 SDK (even if you are in Win7). If you don´t have the necessary components, the creation of the device with the "debug" flag will fail (see below for more info). One easy way to check if you have the components is to check the existance of the NEW DX Control Panel, in C:\Windows\System32.Activating the debug output in D3D 10.x / 11.x is a bit different, as settings are handled per application (you need to add your exe to a list in the control panel, and set an specific configuration for it in there). To do so, please follow these steps:
- 1.- Open the NEW DirectX Control Panel and navigate to the Direct3D 10.x / 11 tab
- 2.- Click on “Edit List” to add your exe to the list of applications controlled by the DX panel
- 3.- In the window that will pop up (below), click on the dots “…” and navigate to your exe file. Then click “Ok”.

- 4.- Back in the main tab, choose the configuration you want (probably want to set “Force On” to force debug output), and mute all the message types you don´t want to see (if any)
You can find more info here, but basically what you need to do is create your Device with Creation Flags including the D3D11_CREATE_DEVICE_DEBUG flag.
Managed D3D 10.x /11.x applications (SlimDX, SharpDX and similar wrappers)
Just like with D3D 9, when developing in C# you should remember to activate the flag “Enable native code debugging” under the Debug tab of your main project properties in Visual Studio. If not, the native debug output cannot get through to the output window (see above in this post for more info).Windows 8.x + Windows SDK
This part covers the case when working in Windows 8.x with the newer versions of the Windows SDK.D3D 9.x
Debugging D3D 9 applications in Windows 8 should work exactly the same as we did in Windows 7. Of course, the new Windows SDK doesn’t include tools to configure D3D9, so you should install the June 2010 DX SDK to get access to the OLD control panel. I couldn’t make sure this works as all my machines are updated to Windows 8.1, so any feedback here will be really welcome.What I can tell you is that, unfortunately, D3D9 debugging seems to be disabled in Windows 8.1. If you open the OLD DX Control Panel, you will see that all the debug parts of the D3D 9 tab are grayed out. I tried by all means to bring it back with no luck, so if you manage to enable it, please let me know.
D3D 10.x / 11.x
Enabling debug output for D3D 10.x and 11.x is pretty much the same as in the case of Windows 7, unless this time you will need to use the NEW version of the DX Control Panel, located in C:\Windows\System32 instead of the usual DXSDK folders.Also, remember to create your devices specifying the D3D11_CREATE_DEVICE_DEBUG creation flag (as described above), and in the case of developing in C#, remember to activate the “Enable native code debugging” option in your main project.
Troubleshooting
- The application works but I get no debug output: If you are in D3D9, make sure you activated the Debug libraries in the old DX Control Panel. Also, if you work in C#, ensure to activate the “Enable native code debugging” option. If you work in D3D 10/11, make sure you created the device with the D3D11_CREATE_DEVICE_DEBUG flag, and don´t forget to add your app to the list of programs managed by the DX Control Panel. In all cases, always use the appropriate DX Control Panel (see above to learn about this).
- In D3D 10.x / 11.x, the application fails while trying to create the device with the DEBUG creation flag: This usually happens if you don´t have the correct SDK installed. If you are in Windows 7 or in Windows 8, make sure you install the Windows 8 SDK. If you are in the latest Windows 8.1 you should install its own Windows 8.1 SDK, as it´s not compatible with the 8.0 SDK version. One easy way to check if you have the components is to check the existance of the NEW DX Control Panel, in C:\Windows\System32.

