Collision detection in XNA

[This article continues the prelude about collision detection published here. It refreshes and completes the older Collision detection in XNA posts –parts I, II and III-, written a long time ago and which were demanded to be completed many times. Finally, here it is]

Simple Collision Detection

XNA includes simple intersection tests for shapes like: Bounding Spheres, AABB (Axis Aligned Bound Box), Planes, Rays, Rectangles, Frustums, etc, and any combination of them. And what is even more useful, 3D models already have bounding spheres for their parts.
Using those tests, almost any kind of game-like intersection can be achieved. You must remember that a Mesh-Whatever intersection is expensive (depending in the number of polygons, of course), and should be left for special cases in which a very high intersection accuracy is needed. So, it’s usually preferred to approximate a complex geometry by a bunch of spheres or boxes, than using the real triangles (see Part 1).
There´s a very good post at Sharky´s blog about XNA collisions, specially focused in approximating generic shapes with bounding spheres. You can find it here.

Accurate collision detectionDespacho_2_Low
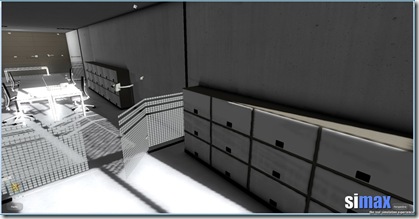

As commented earlier, sometimes a more accurate intersection method is needed. For example, for lighting calculations (where tracing rays are the best and more usual approach to modeling lights –see pic on your right-), the Ray-Mesh intersection test seems to be the best option. In D3D, there´s a Mesh.Intersect method ready for you, that performs the desired intersection test, but in XNA, there´s not such a method, and we will have to do it on our own.
To do it, we will need a system-memory copy of the geometry. Unfortunately, meshes are usually created with the ReadOnly flag in XNA (to make their management fast), what won´t allow us to access their geometry at runtime. To do so, we´ll have to deal with Custom Content Processing.
Note: Here you will find and introduction to Custom Content Processing.

Implementing a Custom Content Processor for collision detection

The solution to the previous problem is to make a custom content processor that stores a copy of the geometry information at build time, where there´s still access to it. All the information needed will be stored in a new class we will name MeshData.
 public class MeshData
{
     public VertexPositionNormalTexture[] Vertices;
     public int[] Indices;
     public Vector3[] FaceNormals;
 
     public MeshData(VertexPositionNormalTexture[] Vertices, int[] Indices, Vector3[] pFaceNormals)
     {
         this.Vertices = Vertices;
         this.Indices = Indices;
         this.FaceNormals = pFaceNormals;
     }
}
 
You can put in here all the information you need. By the moment, it will be enough to store the vertices, indices and face normals.
When VisualStudio processes each model with our ContentProcessor, it will write the model´s data to an XNB file. When it finds a MeshData object, will search for a writer that is able to serialize it, so we have to write our custom ContentTypeWriter for the MeshData class:
[ContentTypeWriter]
public class ModelVertexDataWriter : ContentTypeWriter<MeshData>
{
    protected override void Write(ContentWriter output, MeshData value)
    {
        output.Write((int)value.Vertices.Length);
        for (int x = 0; x < value.Vertices.Length; x++)
        {
            output.Write(value.Vertices[x].Position);
            output.Write(value.Vertices[x].Normal);
            output.Write(value.Vertices[x].TextureCoordinate);
        }
 
        output.Write(value.Indices.Length);
        for (int x = 0; x < value.Indices.Length; x++)
            output.Write(value.Indices[x]);
 
        output.Write(value.FaceNormals.Length);
        for (int x = 0; x < value.FaceNormals.Length; x++)
            output.Write(value.FaceNormals[x]);
    }
 
    public override string GetRuntimeType(TargetPlatform targetPlatform)
    {
        return typeof(MeshData).AssemblyQualifiedName;
    }
    public override string GetRuntimeReader(TargetPlatform targetPlatform)
    {
        return "ContentProcessors.ModelVertexDataReader, ContentProcessors, Version=1.0.0.0, Culture=neutral";
    }
}
 
In a similar way, when the ContentPipeline tries to read back the XNB file, it will search for a deserializer for the type MeshData, so we have to write our own ContentTypeReader:
 public class ModelVertexDataReader : ContentTypeReader<MeshData>
{
     protected override MeshData Read(ContentReader input, MeshData existingInstance)
     {
         int i = input.ReadInt32();
         VertexPositionNormalTexture[] vb = new VertexPositionNormalTexture[i];
         for (int x = 0; x < i; x++)
         {
             vb[x].Position = input.ReadVector3();
             vb[x].Normal = input.ReadVector3();
             vb[x].TextureCoordinate = input.ReadVector2();
         }
 
         i = input.ReadInt32();
         int[] ib = new int[i];
         for (int x = 0; x < i; x++)
             ib[x] = input.ReadInt32();
 
         i = input.ReadInt32();
         Vector3[] normals = new Vector3[i];
         for (int x = 0; x < i; x++)
             normals[x] = input.ReadVector3();
 
         return new MeshData(vb, ib, normals);
     }
}
Finally, our Custom Content Processor that fills up the MeshData objects for each model that goes through it. Note: some parts taken from ZiggyWare
    [ContentProcessor(DisplayName = "Custom Mesh Processor")]
    public class PositionNormalTexture : ModelProcessor
    {
        public override ModelContent Process(NodeContent input, ContentProcessorContext context)
        {
            ModelContent model = base.Process(input, context);
            foreach (ModelMeshContent mesh in model.Meshes)
            {
                // Put the data in the tag.
                VertexPositionNormalTexture[] vb;
                MemoryStream ms = new MemoryStream(mesh.VertexBuffer.VertexData);
                BinaryReader reader = new BinaryReader(ms);
 
                VertexElement[] elems = mesh.MeshParts[0].GetVertexDeclaration();
                int num = mesh.VertexBuffer.VertexData.Length / VertexDeclaration.GetVertexStrideSize(elems, 0);
 
                vb = new VertexPositionNormalTexture[num];
                for (int i = 0; i < num; i++)
                {
                    foreach (VertexElement e in elems)
                    {
                        switch (e.VertexElementUsage)
                        {
                            case VertexElementUsage.Position:
                                vb[i].Position.X = reader.ReadSingle();
                                vb[i].Position.Y = reader.ReadSingle();
                                vb[i].Position.Z = reader.ReadSingle();
                                break;
                            case VertexElementUsage.Normal:
                                vb[i].Normal.X = reader.ReadSingle();
                                vb[i].Normal.Y = reader.ReadSingle();
                                vb[i].Normal.Z = reader.ReadSingle();
                                break;
                            case VertexElementUsage.TextureCoordinate:
                                if (e.UsageIndex != 0)
                                    continue;
                                vb[i].TextureCoordinate.X = reader.ReadSingle();
                                vb[i].TextureCoordinate.Y = reader.ReadSingle();
                                break;
                            default:
                                Console.WriteLine(e.VertexElementFormat.ToString());
                                switch (e.VertexElementFormat)
                                {
                                    case VertexElementFormat.Color:
                                        reader.ReadUInt32();
                                        break;
                                    case VertexElementFormat.Vector3:
                                        reader.ReadSingle();
                                        reader.ReadSingle();
                                        reader.ReadSingle();
                                        break;
                                    case VertexElementFormat.Vector2:
                                        reader.ReadSingle();
                                        reader.ReadSingle();
                                        break;
 
                                }
                                break;
                        }
                    }
                } // for i < num
 
                reader.Close();
 
                int[] ib = new int[mesh.IndexBuffer.Count];
                mesh.IndexBuffer.CopyTo(ib, 0);
                Vector3[] normals = new Vector3[mesh.IndexBuffer.Count / 3];
                for (int i = 0, conta = 0; i < mesh.IndexBuffer.Count; i += 3, conta++)
                {
                    Vector3 v0 = vb[mesh.IndexBuffer[i]].Position;
                    Vector3 v1 = vb[mesh.IndexBuffer[i + 1]].Position;
                    Vector3 v2 = vb[mesh.IndexBuffer[i + 2]].Position;
                    Vector3 edge1 = v1 - v0;
                    Vector3 edge2 = v2 - v0;
                    Vector3 normal = Vector3.Cross(edge1, edge2);
                    normal.Normalize();
                    normals[conta] = normal;
                }
 
                mesh.Tag = new MeshData(vb, ib, normals);
 
            } // foreach mesh
            return model;
        }
    }
Now that we have all the information needed, we will focus in the Collision Detection implementation itself.

Implementing the Ray-Mesh test using the MeshData

Many people thinks that the D3D Mesh.Intersect method does some kind of optimized "magic" to test for intersection, but in fact it just loops through all the triangles of the mesh doing a triangle-ray intersection test, and keeping track of the closest collision point (or all of them, depending on the overloaded version you use). Of course it applies some well known optimizations, like quick discarding polygons, back faces, and so on. That is exactly what we have to do now with the info generated at the Content Processor.
The following method performs a Ray-Mesh test getting as parameter a MeshData object generated by the previous content processor. Note that a lot of optimization can be done here, quick discarding triangles. Just google a bit for it.
public static bool RayMesh(Vector3 orig, Vector3 dir, MeshData pMesh, ref Vector3 pContactPoint, ref float pDist, ref int pFaceIdx)
{
       Vector3 maxContactPoint = Vector3.Zero;
       int maxFaceIdx = -1;
       float minT = float.MaxValue;
       for (int i = 0, countFace = 0; i < pMesh.Indices.Length; i += 3, countFace++)
       {
           int ia = pMesh.Indices[i];
           int ib = pMesh.Indices[i + 1];
           int ic = pMesh.Indices[i + 2];
           Vector3 v0 = pMesh.Vertices[ia].Position;
           Vector3 v1 = pMesh.Vertices[ib].Position;
           Vector3 v2 = pMesh.Vertices[ic].Position;
 
           double t = 0f;
           double u = 0f;
           double v = 0f;
           if (RayTriangle(orig, dir, v0, v1, v2, ref t, ref u, ref v))
           {
               Vector3 appPoint = orig + (dir * (float)t);
               if (t < minT)
               {
                   minT = (float)t;
                   maxFaceIdx = countFace;
                   maxContactPoint = appPoint;
               }
           }
       }
       pContactPoint = maxContactPoint;
       pFaceIdx = maxFaceIdx;
       pDist = minT;
       return (minT < float.MaxValue);
}
The only part left is the Ray-Triangle intersection test, but there is so much information around the net about this issue that I´ll just leave it for you. However, you can check the following links:
http://www.devmaster.net/wiki/Ray-triangle_intersection
http://www.graphics.cornell.edu/pubs/1997/MT97.html
http://www.graphics.cornell.edu/pubs/1997/MT97.pdf
http://www.acm.org/pubs/tog/editors/erich/ptinpoly/
Hope with 4 references is enough, and that you liked the post.
Enjoy!

Introduction to collision detection techniques in games (prelude to collision detection in XNA)

[This post is a refresh version of an older post published here]
Determining if any two 3D objects intersect and get useful information about the intersection is not an easy task. Especially if you want to do it fast. The key to optimize these calculations is to quick discard non colliding objects, before applying the full collision test. To do so, several methods can be applied.
The typical path for discarding is to first divide your scenes into parts (google for Octrees or Portal techniques for further information), keeping track in which part the player is located (and discarding others), and then using BoundXXX discard tests with all the objects in that part. Among others, the most usual are:
  • BoundSphere: Use a hypothetical sphere surrounding objects. If the distance between objects is bigger than the sum of both radius, then they don´t intersect. This fits well for objects similar to a sphere, but not at all for something like a hockey stick, for example. This method is directly supported in DirectX (BoundSphereTest)
  • Axis Aligned Bound Box: Use a hypothetical box surrounding objects. This box is not aligned with the object, but with the world axis (it´s not rotated with the object). It just keeps track of the maximum and minimum values of X,Y,Z along the object’s geometry. It´s also supported in DirectX (BoundBoxTest) and fits best with square geometry, of course.
  • Oriented Bound Box: This one is the more accurate of the three, but of course it´s more expensive to compute. It rotates the bounding box with the object, so it fits better it´s geometry in every case (even if rotated). It´s not supported in DirectX and you´ll have to do it yourself. The best is to calculate a first Bound Box using a convex hull algorithm and then transform it in the same way as the object does.
All this stuff allows you to quick discard non-colliding objects, or to approximate the shape of the entire mesh, if that gives enough accuracy for your application. There are dozens of intersection algorithms optimized for a specific kind of geometry: Ray-Polygon, Ray-Cylinder, Ray-Box, Ray-Sphere, Sphere-Sphere, and so on...
One of the best resources about this intersection tests is Real Time Rendering. I really suggest you to acquire a copy of that book. It´s a must in every graphics programmer bookcase. Once you have it or read the website, try to understand well each method and the complexity it involves. As long as one of your meshes can be approximated well enough with one of that shapes, you should try to use them, because in every case they will be much faster than a full detail Mesh-Mesh intersection test.
Multi-Shape approximation of meshes
As previously said, those test (Box, sphere, etc) doesn´t work only for discarding objects, but also to approximate their shapes making collision detection fast and pretty reliable.This is a very useful method, especially in games. Basically, what we do is to define a collection of shapes that approximate the real shape of the object, and then use Sphere-Sphere, Sphere-Mesh, or anyone of that intersection tests. Just like in the following picture:
clip_image001
Approximation of a plane with a list of spheres
Level of detail for collisions
Another usual method is to use one mesh with high detail for rendering and simpler one for collisions. Like this one:
clip_image003
You should always make this for complex meshes (like characters), if are going to apply any method that uses the entire mesh, like the following:
Full detail: Ray-Mesh test
If you are using DirectX, making a ray-mesh test is pretty straightforward as it´s directly supported by the API via the Mesh.Intersect method. You should take note that a ray-mesh test is as complex as the mesh tested, and in general, is not the fastest way. The DirectX implementation would be:

DX.Direct3D.IntersectInformation intersectionInfo;
if (mesh.Intersect(rayOrigin, rayDirection, out intersectionInfo))
{
// There is collision
}
The IntersectInformation structure gives you the exact Distance between the ray origin and the intersection point, the face index of the mesh the ray hits, and the barycentric U,V coordinates of the intersection point. If you want to know the exact 3D point of intersection you can easily calculate it like:

Vector3 intersectionPoint = rayOrigin + (rayDirection * intersectInfo.Distance);
If you want the normal of the surface in the collision point, use the normal of the mesh face using the face index returned in IntersectInformation.
One thing you must be careful with: this method uses the current state of the mesh. It tests all of its polygons against the ray. If you move or rotate the mesh setting a transform matrix in the Device.Transforms.World, that transformation will not be taken into account. If your objects are dynamic, you should keep track of a mesh version with all its transformations applied to the vertices.
Lastly, if you want to do some serious collision detection, especially if you are planning to do any Rigid Body simulation, my suggestion would be to have a look to the SAT Algorithm (Separation Axes Algorithm). It´s fast, accurate and gives you very useful information, like the MTD (minimum translation distance and direction to solve inter-penetration). You will find dozens of resources over the net about the SAT.

XNA. Customizing the content processing (refresh)

In this post, Ill try to explain the basic concepts of content processing inside XNA and the simplest way to customize it.


Introduction

If you don´t already know, in XNA, all the contents are part of the solution, and are built just like if they were code.
In the build process, they first are imported to a common format (depending on the kind of resource it is). In the file properties, you can choose which importer will load the file:


After that, the content is processed by the ContentProcessor (self-explanatory name ;) specified in the file´s properties, and then the results are stored in an XNB file and copied to the project´s output directory. So, the application loads and uses those XNB files, not the original .FBX, .DDS, or whatever.

Processing contents

One of the biggest advantages of working this way with contents, is that you can customize the processing stage, and store the results in the XNB file. For example, let´s say that your programming team work with an American design studio that works in inches, and you want to transform all your models to meters.
Before XNA, this was something tedious. Basically you had two ways of solving it: do that process every time you receive a new model and store the "transformed version", or do it when the models are loaded in the application (with the delay that implies).
Now, with XNA, you can write your own custom ContentProcessor that makes that transformation. So every time you Build your VisualStudio project, all the contents are processed and stored in the output directory as transformed XNB files. In addition to that, the Content Build is intelligent, and will detect if files have changed or not (and consequently if they need to be rebuilt or not).

How to write a Content Processor

Content Processors must be created in a separate assembly. So, first create a new Library Project with all the XNA references (don´t forget Microsoft.Xna.Framework.Content.Pipeline).
Then add an empty class which inherits from the standard content processor for the kind of content you want to process. For example, a ModelProcessor. This class should be marked with the attribute [ContentProcessor] too. Inside the new class, override the Process method, which will be called by the XNA framework for every model using this processor.
A Content Processor example
[ContentProcessor]
public class VertexTaggedMesh : ModelProcessor
{
    public override ModelContent Process(NodeContent input, ContentProcessorContext context)
    {
        // This converts the raw loaded data of your model to a form that can be written to
        // an instance of the model class
        ModelContent model = base.Process(input, context);
        foreach (ModelMeshContent mesh in model.Meshes)
        {
            // Put the data in the tag.
            byte[] rawVertexBufferData = mesh.VertexBuffer.VertexData;
            mesh.Tag = rawVertexBufferData;
        }
        return model;
    }
}

This example simply stores in the "Tag" property of each mesh, a copy of the vertex information of the mesh. This is useful sometimes, because in XNA the vertex buffer information is not accessible if it was created with the ReadOnly flag (what is the default behavior).
In other posts I´ll include more examples of content processors, but now I´m more interested on how to use them.

How to use the Content Processor DLL

Once we have the Content Processor dll, it´s time to integrate it into the Visual C# Express (or Visual Studio 2008) environment. To do so:
  • If using XNA Game Studio 1.0, go to the project in which you want to use it, and select Project -> Properties -> Content Pipeline. The window contains a list of assemblies used as content processors. Use the button "Add" to include the dll created.
  • If using XNA Game Studio 2.0 or higher, just add a new project´s reference, as any other assembly. Visual Studio will detect it´s a content processor.
After that, a new entry in the Content Processors available for contents (in the file´s properties) should appear. Select that one for the files you want, and voila!
Every time you build your project, the content processor will be executed.

Using a “Collapse All Projects” macro as an example of customizing ToolBars in Visual Studio

 
[This article is a collage of this previous two articles: first and second, and shows how to create a custom button in a toolbar which collapses all your solution projects. Useful if you have solutions with more than 50 projects, like in my case.]
 

Part 1: Collapse All Projects in the Solution Explorer (Visual Studio)

 
If you work in large projects usually, you can end with up to 30, 40 , 50 projects or more inside a single solution.

If that´s your case, it is sometimes a pain in the ass work with the solution explorer. In addition to that, Visual Studio sometimes expands the full solution when opens it. How much time have you wasted clicking project by project just to get a tiny, collapsed solution?

No more!

Thanks to Edwin Evans we have a simple VB Macro that collapses the entire solution. You can find the article here.

Just go to Tools -> Macros -> New Macro Project, rename it as you like, and paste the VB code there. Afterwards, you can create a custom ToolBar in the VisualStudio IDE and add there you new macro as a button.

Et voilĆ”, one click collapse for your entire solution! I´ve tried it and It works, at least in Visual Studio 2008.
PS: To your comfort, I paste here Edwin Evans code:

   Sub CollapseAll()
        ' Get the the Solution Explorer tree
        Dim UIHSolutionExplorer As UIHierarchy
        UIHSolutionExplorer = DTE.Windows.Item( _
            Constants.vsext_wk_SProjectWindow).Object()
        ' Check if there is any open solution
        If (UIHSolutionExplorer.UIHierarchyItems.Count = 0) Then
            ' MsgBox("Nothing to collapse. You must have an open solution.")
            Return
        End If
        ' Get the top node (the name of the solution)
        Dim UIHSolutionRootNode As UIHierarchyItem
        UIHSolutionRootNode = UIHSolutionExplorer.UIHierarchyItems.Item(1)
        ' Collapse each project node
        Dim UIHItem As UIHierarchyItem
        For Each UIHItem In UIHSolutionRootNode.UIHierarchyItems
            UIHItem.UIHierarchyItems.Expanded = False
        Next
        ' Select the solution node, or else when you click
        ' on the solution window
        ' scrollbar, it will synchronize the open document
        ' with the tree and pop
        ' out the corresponding node which is probably not what you want.
        UIHSolutionRootNode.Select(vsUISelectionType.vsUISelectionTypeSelect)
    End Sub

Part 2: How to create a custom ToolBar in Visual Studio

It is sometimes necessary to add custom ToolBars to the Visual Studio IDE. This post will show you how to do it…
1.- Create a new Tool Bar
Just go to Tools –> Customize, you will find a new window like this one:
image

Click on the ToolBars tab, and then in the “New” button. It will ask for the name of the new ToolBar, in our case, the name was: “Macros”. Just type it and press return.

Now, your new ToolBar appears in the list on your left. Be sure to check it, so it will appear in the VisualStudio IDE (you can make it a floating ToolBar or dock it into the upper space for toolbars, whatever you want).


2.- Add a new button to the ToolBar
Go to Tools –> Customize again, but this time click on the “Commands” tab, it´s something like this:
image

You have Command Categories on your left, and all the commands belonging to the selected category on your right.

To create a new button for one of that commands, just Drag&Drop the desired command to your new ToolBar. Easy as that.

3.- Customize the appearance of the button
Again, go to Tools –> Customize –> Commands Tab.
This time, click on the “Rearrange Commands” button. A new window will show with all the customizing options for your menus and toolbars. Just like this one:
image
In this window, you can customize many things, like button order, appearance, icons, texts, whatever.
To customize your new ToolBar, just select the “ToolBar” radio button and your recently created ToolBar in the combo box of your right.
The list on the bottom-left part of the windows will show all the buttons the toolbar contains, and on the bottom-right part you have customizing buttons: add, delete, move up and down and modify.
This last option allows you to change button text (Name), icons, and all that stuff.
Hope you liked it.

Intro to 3D visualization, physically correct lighting, the next steps and the need for a pre-computed illumination model

[This article is a very easy and simple introduction to the concepts of lighting in games, it´s history and the tendency this field is following]
It is certainly impossible to talk about lighting models in realtime 3D graphics without a mention to John Carmack, co-founder of Id Software, and one of the pioneers of the modern gaming industry.

In 1994, Id Software released one of their biggest hits: Doom, using an advanced version of the Wolfenstein-3D engine. One of it´s biggest technical advantages were the more immersive pseudo-3D environment, better graphics and more freedom of movement.

The game was absolutely great, but the 3D environment was, in fact, a 2D space drawn as 3D, and it lacked a real lighting system, as you can see in the following screenshot:


This two issues were solved in a later Id Software´s release: Quake, considered to be one of the first real 3D videogames, and also one of the first games to use a pre-computed lighting model

Let there be light
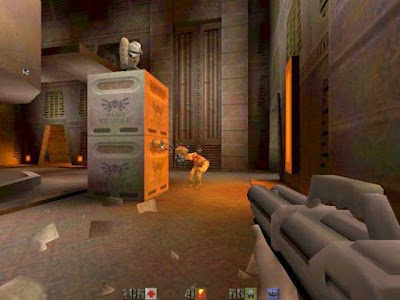
First, a quick look at a Quake screenshot:


[A note for principiants:]

Comparing it with the Doom picture, the first change is that here, everything is 3D. No sprites at all, but polygons, points and textures. And this is crucial, as it makes possible the second change, which is obviously the lighting system. Remember that sprites are just pictures that are copied to the screen when needed, already including their illumination. That´s why they doesn´t work well with other environment lights. Polygons and vertices, unlike them, can hold properties to feed a lighting engine, as position, orientation, etc.

In the screenshot you can see an orange light source coming through the door on the right, lighting the box in the center and the character in the middle. The box also projects a shadow to the floor and there are additional shadows in the walls too. In short, Quake had a very decent lighting model, providing the game with a much more real lighting, and therefore, a better immersion. Let´s see how all this stuff is done...

Vertex lighting. Enough even for quake?

One of the first approaches to 3D lighting models is the so-called Vertex Lighting, which is well covered in this nVidia article. Basically, it computes the amount of light received by every vertex of every polygon that composes a 3D model, and uses that amount of light to modulate the color of the vertex and therefore the interpolated color through the polygon.

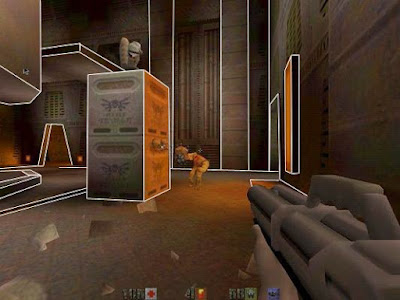
It works well for very high detail 3D models, where the distance between vertices is small, and therefore the sampling frequency is high. BUT, for performance reasons, 3D games cannot have an unlimited level of geometry detail. Even more in 1996. The following picture shows an approximation to the level of geometry used in Quake:

As you can see, it has a VERY LOW level of detail. Take a look at the shadow the box projects to the floor. It is a gradient through the geometry, where no vertex appears, so that gradient cannot be hold by Vertex Lighting.

Even now it´s impossible to use enough detail in geometry to make Vertex Lighting usable as the only lighting model.
So, now what?
The answer is to use some kind of system that allows us to store lighting information in the inner points of a polygon (not only at the vertices), without increasing the real detail of geometry. Think about it as a two dimensional table with numeric values storing the amount of light received by every inner point of the polygon.
Some questions come out quickly now:
1.- How big that table should be?
Of course this comes to a sampling frequency problem: the more samples we take (points per inch, or whatever), the more detail in the lighting.
2.- How do we relate the inner points of the polygon with the entries on the table?
Will see this later.
3.- Will the PC have room for so much information?
Let´s make a quick calculation for Quake: maybe 1000 polygons per scene, with a lighting table of 32x32 samples, makes a total amount of 1.024.000 floats. What is more or less 4 Mb of memory.
Nowadays, it doesn´t look so much, but remember that Quake was released in 1996, when the typical PCs where intel 486 or Pentium in best cases, with a clock frequency between 66 and 133Mhz, and with a system memory of maybe 8Mb or 16Mb. So, wasting one half or a quarter of the total available memory in lighting is definitely not feasible.
4.- Will the PC have enough computing power for that lighting system?
Definitely not. Calculating the lighting for a single point can take a lot of operations, and it would have to be done 1.024.000 times per frame.
Then, how this damn Quake works?
That´s the question. How does a PC like a Pentium 66Mhz handle all this lighting and graphics in realtime?
Easy, it doesn´t.
If you think a little bit, you will realize that though you can move freely through your room, lights normally don´t move, and in most cases, objects neither. So, why not to pre-compute the lighting of static objects just once, storing the results somewhere? That´s what Quake does.
It has a level editor which allows you to place lights through the scene, and calculates the static lighing of the environment offline, storing the results for a later realtime usage.
That saves all the realtime calculations, solving the problem of question #4, but it doesn´t solve the memory problem of question #3, and again it doesn´t explain question #2.
Questions #2 and #3. Lightmaps on the stage
Take a look at the lighting tables which store the results of the offline lighting calculations done by the level editor. Wait a moment... a 2D table storing numeric values... mmmmhhhh... I have seen this before... Digital pictures or Textures are very similar to this stuff: 2D tables of data... And... wait a moment! If I store those results in Textures or digital pictures, instead of simple 2D tables....
Yes, that´s the point. If you store that information in textures, you can:
1.- Use compression algorithms to reduce the amount of memory needed. Lighting will be very similar in many places so block packaging and compression will save A LOT of memory. This helps with the question #3.
2.- You already have a system to relate the inner points of a polygon with the contents of a texture: TEXTURE COORDINATES. This solves question #2.
That´s right. Lightmaps are special textures which store lighting information, instead of the appearance of a base material. Just like this one:
They were widely used in Quake to store lighting and are a great way to add realism to your 3D engine. Since then, Lightmaps are a must in any modern 3D application.
Although there have been some approaches to Dynamic Lightmapping, lightmaps are normally used to store static lighting information only, combined later other kind of lighting that cannot be static, for moving lights or objects: vertex lighting, shadow mapping, shadow volumes, vertex and pixel shaders, etc...

Textures Rock!
Once we have a way to relate points on the surfaces of 3D objects with texels on a texture, we can store any kind of information on them: bumpiness, shininess, shadows, specular components, etc.

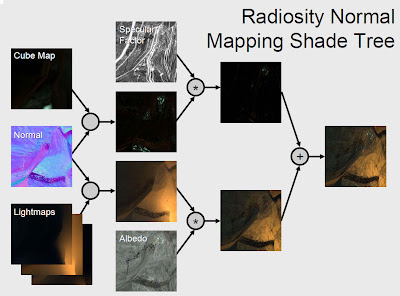
Take a look at the following example taken from here (a very good article on shading). This image belongs to the Valve Engine used in games like Half-Life.

You can see that they use a whole bunch of different textures to store different kind of information about surfaces, getting very good results, as seen in Half-Life 2.
Don´t break the magic
The fight 3D programmers are involved in, since the years of Doom, is nothing more than realism. In other words, don´t break the magic with strange or unaccurate lighting. Try to be accurate and look into the details that make a picture look real. For instance, take a look at this pic:

Another example:

Those pictures use a very simple geometry, and almost no textures... So, what makes them so damn real?
Easy... PHYSICALLY CORRECT LIGHTING
Lighting is everything. It determines the way objects look more than anything else we can use in computer graphics. That images look real because they use a lighting engine with concepts like radiosity or global illumination.
Lighting is not just about finding the amount of light between 0 and 1. A real lighting engine uses photometric lights, with real physical properties, and propagates light correctly through the scene, reflecting and refracting each ray of light. A real amount of light is between -infinity and + infinity, and a real High Dynamic Range display system maps those values to the screen.
The need for a pre-computed illumination model
It´s clear that the next challenge in computer graphics is not realism, but to be able to make all this calculations in realtime. To allow illumination to be really dynamic. With no tricks at all... just real dynamic lighting.
Of course, the amount of calculations to make is huge. So the question is: will we make it in the next few years or will we still need a pre-computed (static) illumination system?
Let´s make a quick assumption. Nowadays, a very good lighting engine like V-Ray can take hours to calculate the illumination of a scene. Let´s say, 10 hours (what is not exagerated at all). We are able to generate a new image every 36.000 seconds.
So, if we want to make those calculations at, maybe, 60 fps (one image every 0.016 secs), we would need a computing power more than 2 million times bigger than the power we have right now, what seems to be a little bit too much. Of course we cannot think the evolution of computing power will be linear, as newer techniques will for sure be discovered, speeding thiings up, but anyway the leap forward is huge and such a thing doesn´t seem to be feasible soon.
So, we will still need pre-computed systems for quite a little bit yet.
Anyway, who knows!

¿Por quĆ© estoy re-publicando algunas entradas?

HabrÔs observado que algunas entradas han sido re-publicadas con la fecha de hoy. El motivo es que he dado de alta este blog en la lista de blogs técnicos de www.codeproject.com. Como éste consume artículos recientes únicamente, algunas entradas que me parecían de utilidad no iban a ser consumidas por el robot de la pÔgina.

Por eso estoy re-publicandolas, para que codeproject se entere.

Siento las molestias.

Localization of .Net applications

These last days, I had the change to mess up with the Localization infrastructure inside Visual Studio 2008. I must realize it´s the first time I seriously get into this issue, and I´m impressed with the work done on it.
When one needs to give an application multi-language support, the first temptation (as old-time programmers) is to build up some sort of tables with strings, each one for each language. That´s more or less what the Localization system will do, but with the following extra features:
A comfortable visual editor
We have a comfortable visual editor to manage the string tables, like this one, giving you the chance to set comments to each entry.
55
Culture infrastructure-ready
The system offers automatic integration with the Culture infrastructure of each application. To get more info about this, check:
  • System.Threading.Thread.CurrentThread.CurrentCulture
  • System.Threading.Thread.CurrentThread.CurrentUICulture
This gives you automatic support for different numbering and date formats, etc.
Integrated with the Visual Studio Designer
To start localizing, you just have to open the design view of a form or control and set the Localizable property of any form or control to True to generate the default resource (.resx) file. From then, each time you 51select a new language in the combo (and change any property), a newer resX file is generated to reflect the change. Of course, all this files are perfectly managed by the Solution Explorer as a part of the form or the control.
Once a form is localizable, each time we change the current language, the designer automatically updates the design view to show the appearance of the form or control in that language. ResX files are also maintained automatically.
Localization of the entire looking (not only texts)
You can make specific versions of each control or user interface for each language, including control positions, dimensions, colors, anything...
This is specially relevant because many times is not enough with just replacing texts. The translation of a text may have a remarkable different length in other languages. In this case we would have to resize the label containing the string, and maybe relocate other controls in the form, as in the following picture, where you can see two version of the same form, for two different languages.
52
Note: Text strings are saved directly in the resx files accompanying the Form1.cs class, but other properties, like dimensiones, locations, etc, are saved in other place. When you compile your solution, in the output directory you will find additional folders with culture-specific names, like “en-US”, etc. This folders will contain additional DLLs created automatically by VisualStudio, one for each localizable assembly. Inside this DLLs, you will find resources defining the appearance of the form´s controls.
Additional String Tables
We have talked about resource files handled by the Designer to reflect the appearance changes of forms for different languages but, what happens with the message shown in a MessageBox? This is not something we can manage in a design view.
A solution is to insert additional .resx files to the project. We can make them “embedded resources” and easily access them with the ResourceManager class directly, although I must tell you this is not the best solution (see next chapter). Of course, there´s no designer to handle this tables, so they will have to be maintained manually (using the visual editor).
To include a complete collection of additional string tables, you can start with the default resx file (for the default language). Give it any name you like, for example: “LocalizedStrings.resx” (just click your project with the right button, and select “Add New item”, and then “Resource File” as the item type). Afterwards, you can add any other language version for that file, using the same name with the culture-specific string representation before the extension. Some examples:
  • LocalizedStrings.en-US.resx
  • LocalizedStrings.es-ES.resx
  • LocalizedStrings.fr-FR.resx
Strongly-typed access to string tables
This is also a very important feature, because once you have your string table up and running, you need to get access to it from your code. You can do so directly through the ResourceManager.GetString() method, but this is definitely not a good idea. Mostly because you will have to give it the name of the entry you are looking for, in the form of a simple "string”.
This means that you will have no Intellisense support (you will have to look the name of the properties in the table by yourself), and if any property name is changed later, there will be no compiling warning or error. This means that if you are not extremely careful for the rest of your application´s life, you won´t notice the mistake until runtime, and this is extremely bug-prone.
The solution is to make a strongly-typed class, which includes code properties to access each entry in the table. Of course, it would be a non sense if we had to make them manually (it would be the same as accessing though the ResourceManager class). Thankfully VisualStudio includes a tool to take care of such task: the ResXFileCodeGenerator. To make VisualStudio invoke this tool, you will have to put it´s name (“ResXFileCodeGenerator”, without quotes) in the Custom Tool property of the default resx file. This is important: IN THE DEFAULT resx file. This means that, if you have LocalizedStrings.resx (with the default language, spanish for example), and LocalizedStrings.en-US.resx, you have to set the custom tool to the first one.
53
When you do so, a new “.cs” file will be generated for you (below the resx file) containing the strongly-typed class. Though the maintenance of this class is automatic, you can force a refresh anytime you want by clicking the resx file with the right button and selecting “Run custom tool”.
From now, you can access your strint table texts with Intellisensed, strongly-typed, in-code properteties like:
“text = LocalizedStrings.strWarningCaption”
APPENDIX A: Making an automatically-generated, strongly-typed class to be PUBLIC
By default, strongly-typed classes generated with the ResXFileCodeGenerator tool are INTERNAL. This means that they will only be accessible inside your assembly.
To make one of this classes public, you cannot just change its code as it will be re-generated by the tool on next rebuild. You have to change the custom tool, selecting the PublicResXFileCodeGenerator instead of the previous one. It will make them public for you.
You can also do this “double-clicking” your string table (to enter the visual editor view), and selecting the PUBLIC modifier in the upper part of the screen (this actually changes the custom tool as explained above).
Well, it´s been long, but hope it helps someone. However, this is my first approach to Localization and therefore, for sure there will be people with deeper knowledge on this issue. Please feel free to complete (or correct) this tutorial with comments and suggestions.
Thanks!

Parallel computing and processor affinity. Never underestimate the Windows Vista Scheduler

[Traducido al Español por Matías Cordero. Puedes leer la versión en Castellano aqui]
Everyone knows that parallelization is a hard but important issue, as it seems that it´s not affordable anymore to increase CPU clock speeds. The future is multi-core! So you should start getting familiar with System.Threading a.s.a.p. ;)
Determine the appropriate balance
When one identifies a parallelizable task, it´s always hard to find the appropriate balance for parallelization. Is it better to open more threads or is it better to give more work to each thread? The answer to that question of course depends on many things, and remarkably on the nature of the task each thread will handle.
It is important to guess the amount of time that task will idle in each thread. If it´s an intensive task, then better start less threads with more work each. If it´s just the opposite (a task that will frequently idle waiting for something -IO, graphics, whatever-), then better open more threads with less work, as they will scheduled through the physical cores of your machine when one is idling. Of course, never open less threads than your machines physical cores!
What´s the objective? The same as in hotels… 100% occupancy.
An easy way to determine the nature of our task is to let it run on a single CPU, and see the Task Manager CPU usage history graph. This will give you an idea of the CPU usage your process made. You will ask now how to force your application to run in a specific CPU. The answer is Processor Affinity (see below).


To loose, or not to loose control. That´s the question…
When one starts dealing with parallelization, the first idea is to split processes through the CPUs oneself. Why not? If you have 10.000 operations, then open four threads with 25.000 operations each. First for CPU0, second for CPU1 and so on… I´d feel very comfortable with this idea. Neat and clean, and everything under control, right? Well, it´s not always that simple.
In an ideal world, a single task that is not going to be parallelized anymore and that lives alone (not with the dozens of neighbors a process has in a modern OS), is better handled by a single CPU, as this will increment cache hits and eliminates any thread switching infrastructure overhead. But in real life, processes are interrupted by OS operations, IO, other processes and many other things. A multi-core machine is perfect for handling all that interruptions, as it can spread them all through the existing cores, but if we all start fixing our applications to specific CPUs, the capacity of the OS to avoid locks and waits is heavily reduced.
As this great article explains, most of the times, it is much better to rely onto the Operating System so it can put each thread wherever he wants. However, we´ll see some results regarding this decision later.


Processor affinity of a process

In Windows, you can force a process to run in a specific CPU just using the Task Manager (right click your process and select “Set Affinity”) or programmatically using the System.Diagnostics namespace. The following line will change current process affinity to CPU 1:
System.Diagnostics.Process.GetCurrentProcess().ProcessorAffinity = (System.IntPtr)1;
The ProcessorAffinity property is a bit mask variable. So, the values are:
Value Allowed processors
0 (0000) Not allowed (that would mean use no processors)
1 (0001) Use processor 1
2 (0010) Use processor 2
3 (0011) Use both processors 1 and 2
4 (0100) Use processor 3
5 (0101) Use both processors 1 and 3
6 (0110) Use both processors 2 and 3
7 (0111) Use processors 1,2 and 3
8 (1000) Use processor 4
and so on…  
Please note that this will change the affinity of the current process (your entire application), not of the current thread. Any thread opened from this process will inherit the same affinity.

Processor affinity of a thread

A first requirement in order to control how your threads are distributed through CPUs is to be able to set a thread´s affinity (not a process). There is an interesting post about this issue here, where Tamir Khason explains the whole thing. To change a thread´s affinity we must use the System.Diagnostics.ProcessThread class (ProcessAffinity property). The problem comes when one tries to find out which thread is the one we are looking for, in the list of the current process´ threads.

First Approach - Deprecated

We get the ProcessThread instance with the following code:
ProcessThread t = Process.GetCurrentProcess().Threads.OfType<ProcessThread>().Single(pt => pt.Id == AppDomain.GetCurrentThreadId());
t.ProcessorAffinity = (IntPtr)(int)cpuID;
The problem with this approach is that the method GetCurrentThreadId is deprecated, so better you don´t use it.

Second approach – Not valid

You could be tempted to use the ManagedThreadID to search inside the Threads collection of your process. Don´t do it. ProcessThread.ID has nothing to do with the ManagedThreadID property, they represent different things. A guy says here that ManagedThreadID is in fact the offset inside the ProcessThread collection, but I didn´t investigate any further, and I wouldn´t advise you to do so unless you verify this information

Third approach – Valid but unmanaged

The third approach will “dllimport” kernel32.dll and use some of it´s functions. This method is tested and works correctly. Here we go:
[DllImport("kernel32.dll")] 
static extern IntPtr GetCurrentThread();
[DllImport("kernel32.dll")] 
static extern IntPtr SetThreadAffinityMask(IntPtr hThread, IntPtr dwThreadAffinityMask);
SetThreadAffinityMask(GetCurrentThread(), new IntPtr(1 << (int)cpuID));
A curious note:
If you are programming for the XBox360 with the XNA Game Studio 3.0, you have a Thread.SetProcessorAffinity method ready for you, without all the garbage above. This is just because the XBox specially needs to take advantage of its cores to give a decent performance. I don´t know if the presence of this method is due to a worse performance of the XBox Scheduler than in Vista… may be. However you can read further here.


The Tests

Task: Generation of three 2D tables of information as a result of a geometric test in a 3D scene, involving 975.065 collision tests (ray-mesh) each
Hardware: Dell XPS 630 QuadCore
Monitoring software: Process Explorer

PART 1 (multithreading disabled). Impact of processor affinity

Test 1:
  • Number of threads: 1 (main thread)
  • Processor affinity: CPU 1
  • Total time: 2 min 57.11 secs
image
With processor affinity enabled to CPU 1, all the work is obviously handled by this CPU. The two peaks you can appreciate in the graph are due to a IO operation (saving data to disk) and clearly demarcate the generation of each table of data. In this test we can clearly appreciate that our task is very intensive and constant, as keeps the processor at a 100% usage almost all the time.
Test 2:
  • Number of threads: 1 (main thread)
  • Processor affinity: None (any processor)
  • Total Time: 2 min 29.45 secs
image
Most of the work was handled by CPU 2 but the rest of cores also worked on the process (checked in Process Explorer that all the green lines belonged to the process being measured). It is clear that forcing the thread to work in CPU 1 only introduced locks and waiting periods probably due to interruptions coming from other programs that needed CPU 1 too.
Winner of part 1 ………  Windows Scheduler !

PART 2 (multithreading enabled 1)

Test 1:
  • Number of threads: 2 (main thread + 1 calculation thread)
  • Processor affinity:
    • Main thread: Any
    • Calculation thread: CPU 1
  • Total time: 2 min 18.14 secs
image
The results we are getting here are quite logical. The main change in this test is that we are separating the calculation from UI update and IO saving to disk. You can appreciate the low peaks in the first graph and their equivalent in cores 2 and 3 (where the saving operation is placed). It is very interesting to note that separating the saving operation to different cores doesn´t save any time, because we wait for it to complete before continuing with the next table of data. That´s why now the low peaks in the first graph are much more noticeable. We have moved some computing from one core to another, but not parallelized anything.
However, we get a small performance improvement, mostly because now the UI update (which involves some Bitmap manipulation) is now done at cores 2 and 3
Test 2:
  • Number of threads: 2 (Main thread + 1 calculation thread)
  • Processor affinity: None
  • Total time: 2 min 14.86 secs
image
This time, we can again appreciate that work has been scattered through all cores, with a more remarkable presence of CPU 2. Again, the Windows scheduler wins the race.
Winner of part 2 ………  Windows Scheduler !

PART 3 (multithreading enabled 2)  

Test 1:
  • Number of threads: 3 (main thread + 2 calculation threads)
  • Processor affinity:
    • Main thread: Any
    • Calculation threads: CPUs 1 and 2
  • Total time: 1 min 18.66 secs
image
We start to see a big performance improvement here. Twice the computing power, almost twice faster. That seems quite realistic.
Test 2:
  • Number of threads: 3 (main thread + 2 calculation threads)
  • Processor affinity: None
  • Total time: 1 min 16.59 secs
image
Another win for the Windows Scheduler. Obviously when the total time gets shorter, the differences too, but the OS still wins.
Winner of part 3 ………  Windows Scheduler !

PART 4 (multithreading enabled 3)
Test 1:
  • Number of threads: 5 (main thread + 4 calculation thread)
  • Processor affinity:
    • Main thread: Any
    • Calculation threads: CPUs 1, 2, 3 and 4
  • Total time: 41.76 secs
image
Now comes the huge performance improvement. With 4 calculating threads, the total time gets reduced to 41 secs!. Let´s see how the OS performs with 5 threads.
Test 2:
  • Number of threads: 5 (main thread + 4 calculation thread)
  • Processor affinity: None
  • Total time: 42.05 secs
image
Wow… That was too close! This time we must mark the OS as looser.
Winner of part 4 ………  Processor Affinity! (it was close)

PART 5 (multithreading enabled 4)
Test 1:
  • Number of threads: 9 (main thread + 8 calculation threads)
  • Processor affinity:
    • Main thread: Any
    • Calculation threads 1..4: CPUs 1..4
    • Calculation threads 5..8: CPUs 1..4
  • Total time: 41.07 secs
 image
Test 2:
  • Number of threads: 9 (Main thread + 8 calculation threads)
  • Processor affinity: None
  • Total time: 38.24 secs
image
Wow… this is my boy! 38 secs !!!
However, this are expected results. If you set more threads than physical cores, it is obvious that some thread scheduling should have to be done. Forcing threads to work on a certain CPU just brings down parallelization. As you can see we get almost no benefit when using 8 calculation threads instead of 4 (if affinity is enabled). So it´s clear that giving some freedom to Windows here, just to do its job, is by far the best option.
Winner of part 5 ………  Windows Scheduler !
 

Results

 graph


Test Vista Scheduler Processor Affinity
Part 1 149.45 secs 177.11 secs
Part 2 134.86 secs 138.14 secs
Part 3 76.59 secs 78.66 secs
Part 4 42.05 secs 41.76 secs
Part 5 38.24 secs 41.07 secs

So, what´s the optimal number of threads for my task?

Does this tendency (the more threads, the higher performance) continues forever? The answer is, obviously, no.
In an ideal, 100% intensive and constant task, the optimal number of threads would be the number of physical cores, but in real life, such an intensive task is very difficult to find. Almost every computation algorithm will have idle times, waiting for a memory paging operation or whatever. So, the number of threads that will give you top performance will depend on the intensiveness and constancy of your application.
I have measured some additional timings (for the OS scheduler version only):
        • 16 threads –> 37.89 secs.
        • 18 threads –> 37.44 secs.
        • 24 threads –> 38.03 secs.
So, for this task the tendency seems to break at 18 threads. You will have to make your own tests to find the optimal number of threads for your algorithm. However, we have proven that even in such an intensive task as this one, the optimal number of threads seems to be around 18 for a quad core machine, that means more than 4 times the number of physical cores!


Conclusions

1.- The Windows Scheduler does a GREAT job (specially in Vista). It beats a manual processor affinity setup almost in every cases, and in those where a manual setup wins the race, it´s by a very short distance.
2.- Even if the OS was a little bit worse in all cases would be advisable to use it, mostly because it´s automatic and you don´t have to worry about your thread´s location
3.- Processor affinity is one of the most important parallelism blockers, so use it if you really need it only, not because you are smarter than Vista. In other words: do not re-invent the wheel. Trust the OS wisdom.
 4.- Windows Vista Scheduler Rocks !


What´s all this information been used for?

Almost one million ray-mesh intersection tests, and what´s this stuff all about? Some people here in Spain says that if it´s white, and comes in a bottle, it´s probably milk… ;)
Massive Ray-Mesh intersection tests + Results stored as 2D table of data = Probably lighting calculations
This are the real results… hope you like it.
 
3darchitecture_chair_low


Take care!

How to download full projects from Google Code, with no SVN clients

This is a short translation of this article, just to make it readable for non-spanish speaking people.

If you want to download full project´s source code from Google Code, you have two options:

  1. Install a SVN client like Tortoise, and learn how to configure it.
  2. Use the DownloadSVN, a very good resource.

Just plug the project´s URL in the window and push “Start”. ¿Which URL? The one found in the “Source” tab at Google Code, like in the following pic.

image

Cómo descargar proyectos enteros de GoogleCode en una patada, sin clientes SVN

[English version here]

Si estĆ”s interesado en ver cómo funciona un proyecto alojado en GoogleCode, pero tienes la desgracia de que sea muy grande, la funcionalidad estĆ”ndar de Browsing a travĆ©s de su pĆ”gina web se te va a quedar corta. Lo mejor serĆ­a que hubiera un botón “Descargar Proyecto”, pero no lo hay. Supongo que pensaron que ya era suficiente ayuda publicar el código fuente… ¡TrabĆ”jatelo un poquito niƱo!.

En fin, que como somos muy vaguetes, pensƩ que debƭa haber otra forma, asƭ que seguƭ el consejo ofrecido aqui, y usƩ el puto google.

  • Opción 1: Instalar un cliente SVN como Tortoise, y buscar información como Ć©sta sobre cómo usarlo… ufff… mucho curro?
  • Opción 2: Para los super-lazies. Utilizar una herramienta magnĆ­fica llamada DownloadSVN.

Solo tienes que decirle la URL del proyecto y ella solita se pone a currar. Lo he probado y funciona mu bien.

Ahora me preguntarĆ”s, ¿quĆ© URL es la que tengo que poner?. La que sale en la pestaƱa “Source” del proyecto en google code, como la de la siguiente foto:

image